Strategic Scenario Simulations
Know the odds before you bet the budget.
Monte Carlo stress tests for decisions where the outcomes don't move in straight lines.
Scenario Comparison
Scenario Outcomes
Base case — 62% probability
HighPlanned transformation
Full adoption, on-time delivery. SGD 13.3m/yr. Payback tracked through the engagement.
Downside — 28% probability
MediumAdoption challenges
60% adoption, 3-month delay. SGD 7.1m/yr. Still IRR >60%.
Upside — 10% probability
UpsideAccelerated adoption
90% adoption, early delivery. SGD 18.2m/yr. 12-month payback.
Prepared by Truth Engine · CONFIDENTIAL
Unified solution
One verified output your team can inspect, challenge, and act on.
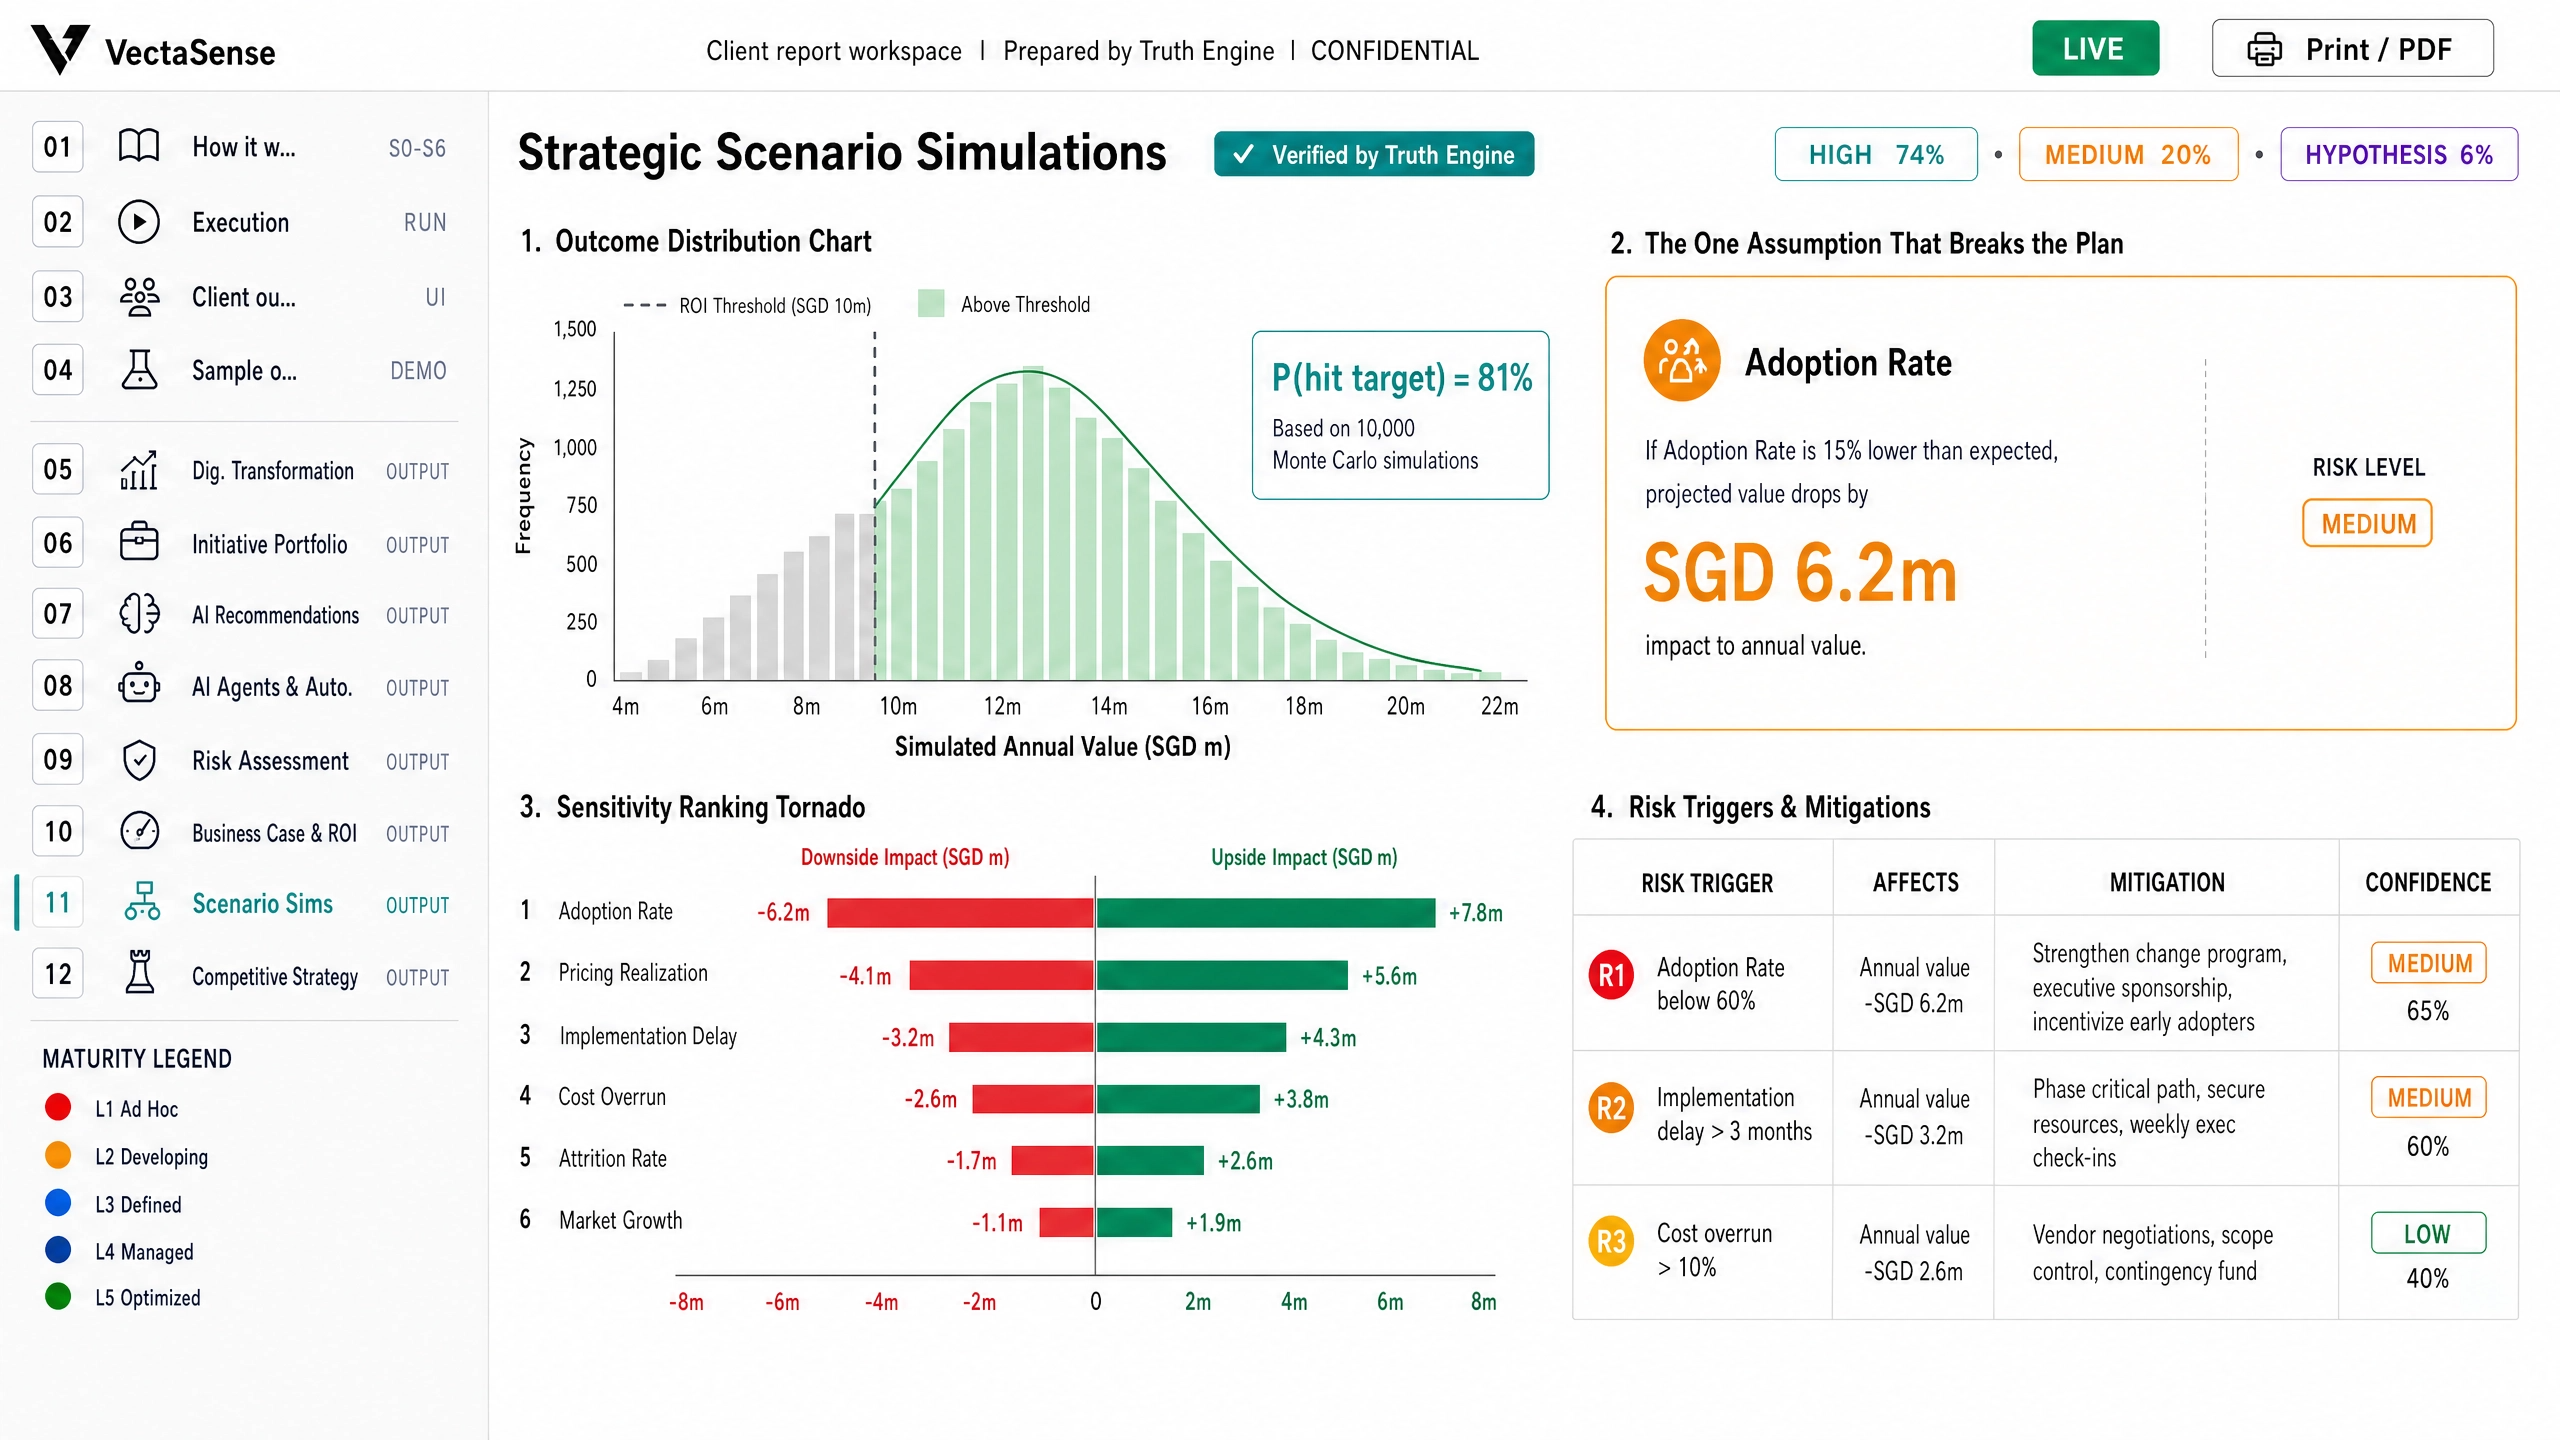
Vectasense strategic scenario simulations stress-test a decision across thousands of plausible futures using Monte Carlo modelling — showing the probability of hitting your target, the shape of the downside, and the single assumption most likely to break the plan. Instead of a best, base, and worst case (which systematically overstates returns, because business models multiply variables rather than add them), you get the full distribution of outcomes, the frequency of clearing your threshold, and a sensitivity ranking of what drives upside and downside. Every input is confidence-tiered by the Truth Engine, and simulations can be re-run as real data arrives during Operate & prove. The result: you bet the budget knowing the odds, not just the story.
What it unlocks
Move from opinion-led debate to visible evidence and clear decisions.
01
What are the actual odds?
You replace false confidence with real odds. Averaging best and worst case systematically overstates returns, because business models multiply variables rather than add them — the math hides the risk. You get the actual distribution of outcomes, the probability of clearing your threshold, and the single assumption whose failure does the most damage.
02
What's in the simulation?
Monte Carlo simulations across the variables that matter — demand, cost, adoption, timeline, capacity, margin; probability ranges for target outcomes instead of a point forecast; sensitivity analysis showing which variables drive upside and downside; and risk triggers with mitigation options tied to the recommendation they affect.
03
Which assumption breaks the plan?
The simulation surfaces the single variable whose failure does the most damage — so you know where to put your monitoring and your mitigation before you commit.
Sample deliverable
Proof design
Value is made measurable before execution starts.
The most dangerous forecasts are the ones with a single confident number. Showing the range, the target-hit frequency, and the fragile assumptions turns a gut call into a risk-adjusted decision — and tells you which initiative sequence gives the best odds. Related outputs: Business Case & ROI Model, How It Works, and Truth Engine.
Leadership focus
Core questions and strategic considerations.
- What's the probability this clears our ROI threshold?
- Which assumption is most likely to break the plan?
- How does the downside change if demand, cost, and timeline move together?
- Which sequence gives the best risk-adjusted outcome?
04
Why Monte Carlo instead of a base-case forecast?
A base case hides the range. Monte Carlo shows the distribution: how often the target is reached, what the downside looks like, and which variables drive the result — which makes the decision more robust.
05
Can simulations be updated after execution starts?
Yes. As real data arrives, assumptions can be updated and the simulation rerun. That is especially useful during Operate & prove, where Vectasense tracks whether the strategy is behaving as expected.
Next step
Scope this solution around the decision you need to make first.
Last updated: June 2026